R.Geoff Richards, Martin Stoddart, Angharad Simpson, Pamela Furlong
AO Research Institute, 7270 Davos, Switzerland
geoff.richards@aofoundation.org
Keywords: human; sheep; bone, cartilage; osteocytes / osteoblasts; perfusion chamber; reduction; replacement; validation
Duration: 1 year Project Completion: 2004
Background and Aim
The investigation of bone biology and changes within the bone, is normally undertaken by using either an animal model or cell culture systems. Animal models can not ensure the identical bone structure and biology to that within humans. The widely used two-dimensional cell culture lacks natural occurring cell integrity, three-dimensional relationships, phenotypic characteristics as well as natural load. In order to understand mechanical support and mineral homeostasis of bone, one must have both the cells and bone matrix combined in an isolated, 3D culture. A need exists for an ex vivo bone culture system, where a controlled biochemical and mechanical environment is created to be able to determine the influence of different parameters.Therefore a 3D loading culture system for human bone was developed as reported in project 78-01.
Method and Results
The method was modified from culturing of cancellous bone cores by Davies and colleagues, 2006 [1]. Cancellous bone explants were obtained from human femoral heads (Ethic Commission Graubünden approval (18/02)) were processed (Fig1) into cylindrical cores (5mm height, 9.5mm diameter) for the viability studies. The cores were inserted into the culture chambers, randomly assigned to groups and subsequently cultured for up to 14 days. Groups included, with or without TGFβ3 (15ng/ml) and with or without loading (300 cycles at 1 Hz, giving 4000 microstrain) and heat treated dead cores as a control. As fresh tissue controls bone cores were fixed with 70% ethanol immediately after excision (T0). The samples were then mechanically stimulated for 5 min each per day in the “complete jump” waveform which elicited a 4000μstrain at a frequency of 1Hz, and approximately 300 cycles. The maximum displacement of the tissue was 20 µm, and minimum 5 µm. Cores were cultured for either 7 or 14 days before undergoing viability assessment. Fresh tissue control cores (T0) were assessed for viability immediately after the washing sequence on the day of harvest from the femoral head to act as positive controls. Post culture cell viability was assessed by cutting the cores into 250µm thick sections and the LDH assay was performed [2]. All remaining cores were fixed in 70% ethanol, dehydrated through an ethanol series and embedded into Technovit 9100 New [3] for subsequent histological and immunohistochemical evaluation.
Histology of live cultured samples after 14 days in the Zetos system was comparable to fresh bone (T0) (Fig2). Non collagenous proteins such as bone sialoprotein and osteopontin were localised through immunohistochemical labelling of sections (Fig. 3). The LDH assay displayed a uniform purple/blue staining (LDH positive) over the entire section on a macroscopic scale of the fresh, live tissue. Many dark stained osteocytes were seen in the bone cores cultured for 14 days in the loaded Zetos culture after administration of TGFβ3. The dead sections however did not exhibit any dark, defined osteocytes and only the empty lacunae were visible (Fig. 4). The number of viable osteocytes observed in the fresh tissue (T0) was greater than after 7 and 14 days in Zetos culture (Figures 5-8). However, in all cases there appeared to be a positive effect of loading on the number of viable osteocytes present after 7 and 14 days in Zetos culture compared with the unloaded samples (Figures 5-8). In most cases the effect of loading plus TGFβ3 on viable osteocytes was even greater.
Conclusions and Relevance for 3R
The bone bioreactor system permits the culture of viable 3D human trabecular bone cores up to 14 days. The outcome of this work shows that this ex vivo loading bioreactor is able to maintain a high percentage (over 50%) of viable osteocytes throughout the bone cores after 14 days in ex vivo culture. Further to this, the combination of daily loading and TGFβ3 administration produced superior osteocyte viability at the core centres when compared to loading alone.
By allowing the bone cells to be cultured in their near to natural microenvironment the Zetos system overcomes the limitations observed with cell and organ culture. The bioreactor has potential in pre-testing the integration of human bone with biomaterials, studying basic bone biology including osteoporotic bone.
(see also 3R-INFO-BULLETIN Nr. 28)
Published updated Version 28/2007 (pdf)
Acknowledgements
The authors would like to thank 3R #86/03 and ESA MAP project AO 99-122 for funding. Thanks to Dr. Thomas Perren (Davos Hospital), Dr.Heinz Bereiter (Chur Hospital) for supplying human tissue.
References
1) Davies CM, Jones DB, Stoddart MJ, Koller K, Smith E, Archer CW, Richards RG (2006) Mechanically loaded ex vivo bone culture system ZETOS: Systems and culture preparation. European Cells and Materials 11, 57-75. can be downloaded for free from http://www.ecmjournal.org/journal/papers/vol012/vol012a02.php
2) Stoddart MJ, Furlong PI, Simpson A, Davies CM, Richards RG (2006) A comparison of non-radioactive methods for assessing viability in ex vivo cultured cancellous bone. Eur Cell Mater 12, 16-25. can be downloaded for free from http://www.ecmjournal.org/journal/papers/vol011/vol011a07.php
3) Yang R, Davies CM, Archer CW, Richards RG (2003). Immunohistochemistry of matrix markers in Technovit 9100 New®-embedded undecalcified bone sections. Eur Cell Mater (6) 57-71. can be downloaded for free from http://www.ecmjournal.org/journal/papers/vol006/vol006a06.php
Figures
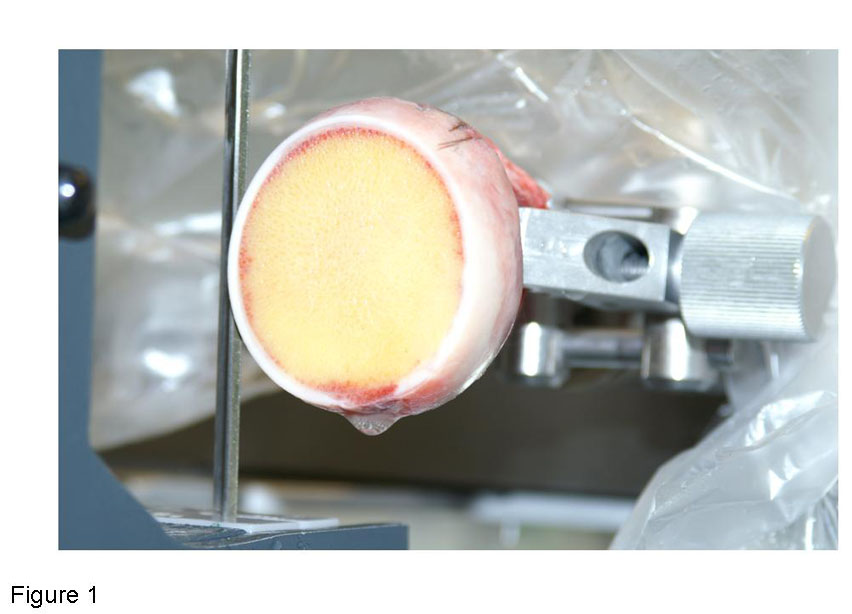
Figure 1: Human femoral head being cut into 7 mm thick slices in order to bore cores, 10 mm in diameter, from the tissue that would be cultured ex vivo in the Zetos bioreactor.
Figure 2
i) Toluidine blue stained human tissue (71 yr male), cultured loaded within the Zetos system for 14 days without the addition of TGFβ3. Not much new bone formation visible, most surfaces were quiescent. ii) Masson stained, tissue (81 yr male), cultured in the loaded system for 14 days without the addition of TGFβ3. Osteoclasts present in Howship’s lacunae (red arrows) iii) Toluidine blue stained and iv) Masson stained human tissue (54 yr male), cultured loaded within the Zetos system for 14 days with the addition of TGFβ3, displaying normal morphology
Figure 3
Human bone tissue (70 yr male), cultured in the Zetos system for 14 days. i) Movat stained section depicting osteoid seams in red and calcified tissue in yellow. ii) Bone sialoprotein labelled section (10 µg/ml polyclonal rabbit anti-human). Surface undergoing resorption - green arrow, osteoid seam - red arrows. iii) Osteopontin stained section (10 µg/ml polyclonal goat anti-rabbit). Surface undergoing resorption - green arrow, osteoid seam - red arrows. iv). Negative control – omission of primary antibody.
Figure 4
High power images of human bone tissue (54 yr male). Mid-sections, 250 μm-thick stained for viability using LDH-assay. a. and b. Show an image taken from a T0 section, imaged in brightfield mode and the corresponding fluorescent image. The darkly stained osteocytes can be seen in the bone matrix in both images, and the viable marrow has stained dark purple in the brightfield image. c. and d. Show an image of a dead core taken after 14 days in loaded Zetos culture, imaged in brightfield mode and the corresponding fluorescent image. No darkly stained osteocytes can be seen in the bone matrix in either image, only the empty osteocyte lacunae. There is no dark purple-stained viable marrow in the brightfield image, only remnants of dead marrow. e. and f. Show an image of a core taken after 14 days in loaded Zetos culture after administration of TGFβ3, imaged in brightfield mode and the corresponding fluorescent image. Many darkly stained osteocytes can be seen in the bone matrix in both images. There is also dark purple-stained viable marrow in the brightfield image. Overview images only, not used for quantification.
Figure 5
Graphical representation of the quantified osteocytes present in the central area of bone cores at T0 (fresh tissue) and after 14 days in Zetos culture (54 yr male), under different experimental conditions. Dark blue depicts 14 day time point. a Load (no TGF) group shows a significant difference from the unloaded (no TGF) group (p<0.05). b Load + TGF shows significant differences between Unloaded no TGF group (p<0.01) and Load no TGF group (p<0.01).
Figure 6
Graphical representation of the quantified osteocytes present in the central area of bone cores at T0 (fresh tissue) and after 7 and 14 days in Zetos culture (46 yr female), under different experimental conditions. . Light blue depicts 7 day timepoint, dark blue depicts 14 day time point. a indicates a significant difference of Load + TGF group when compared with Unloaded no TGF group at 7 days (p≤ 0.011). b indicates a significant difference of Load+TGF group when compared with Unloaded no TGF group at 14 days (p≤ 0.001).
Figure 7
Graphical representation of the quantified osteocytes present in the central area of bone cores at T0 (fresh tissue) and after 7 and 14 days in Zetos culture (70 yr male), under different experimental conditions. Light blue depicts 7 day time point, dark blue depicts 14 day time point. a. indicates a significant difference between the Load + TGF group at 14 days and the unloaded no TGF group at 14 day (p≤ 0.001).
Figure 8
Graphical representation of the quantified osteocytes present in the central area of bone cores at T0 (fresh tissue) and after 7 and 14 days in Zetos culture (66 yr female), under different experimental conditions. Light blue depicts 7 day time point, dark blue depicts 14 day time point. No statistically significant differences in viable osteocyte density were found between treatment groups within each time point in this experiment.
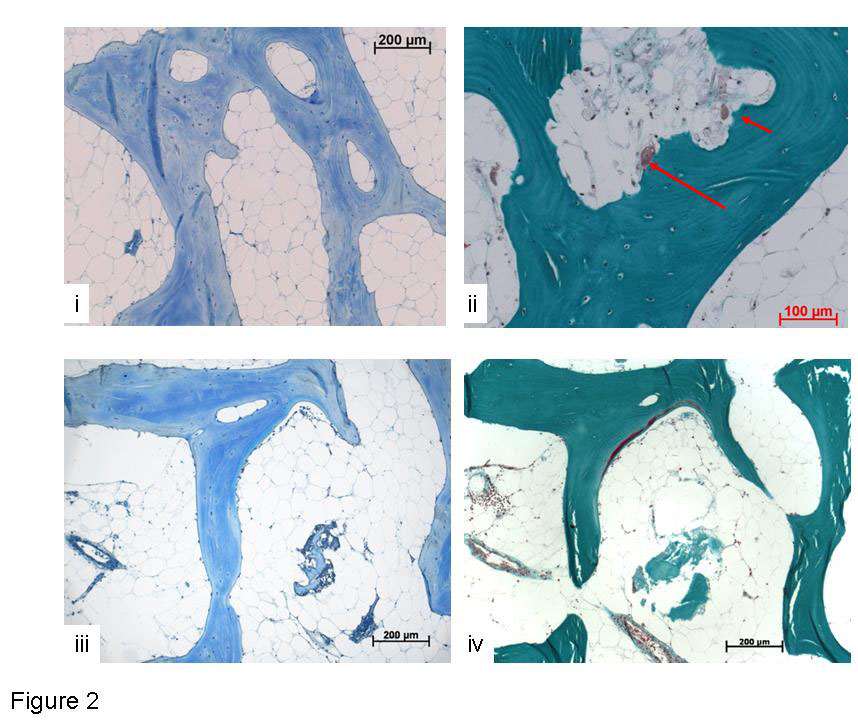
Figure 2
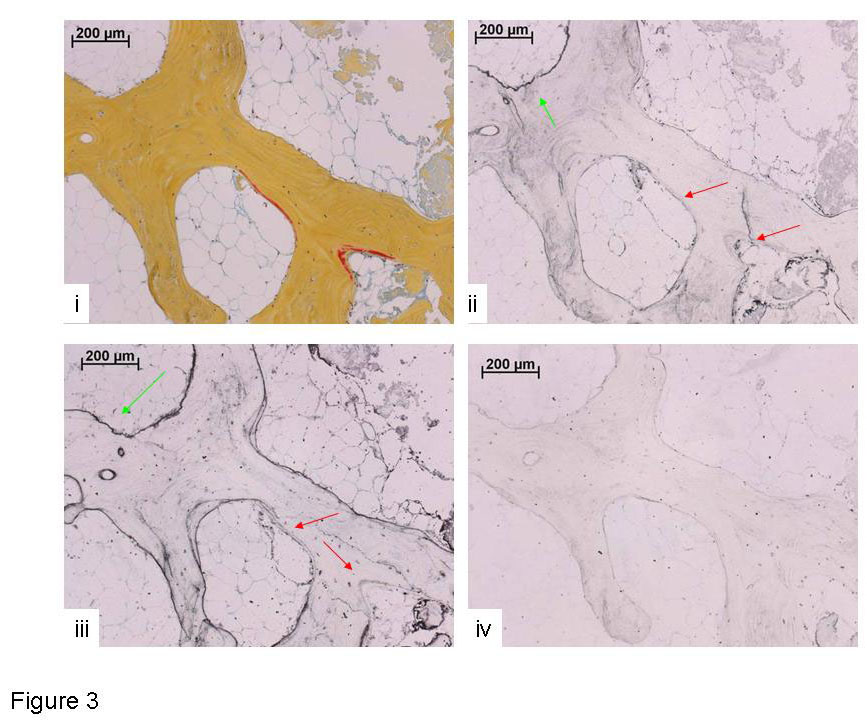
Figure 3
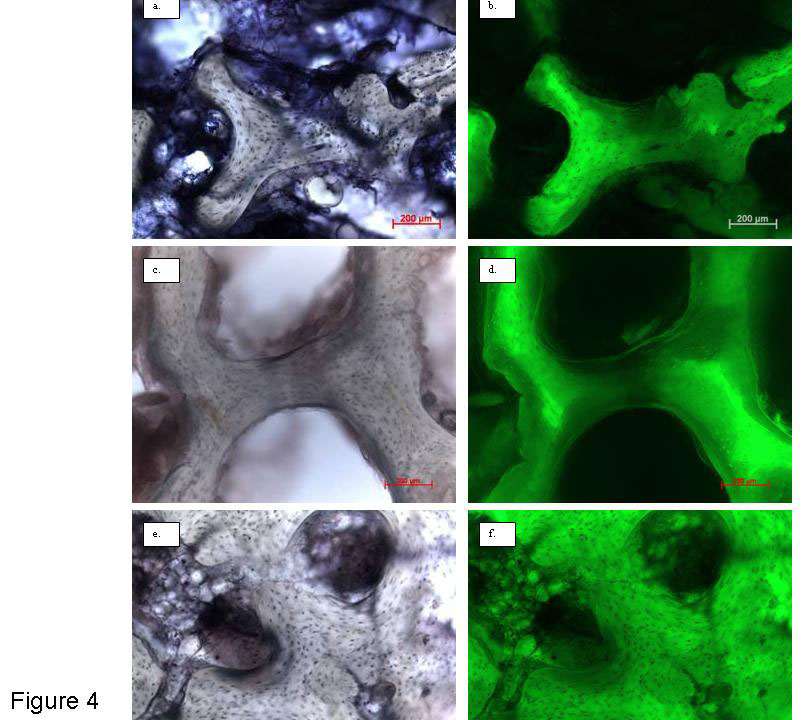
Figure 4
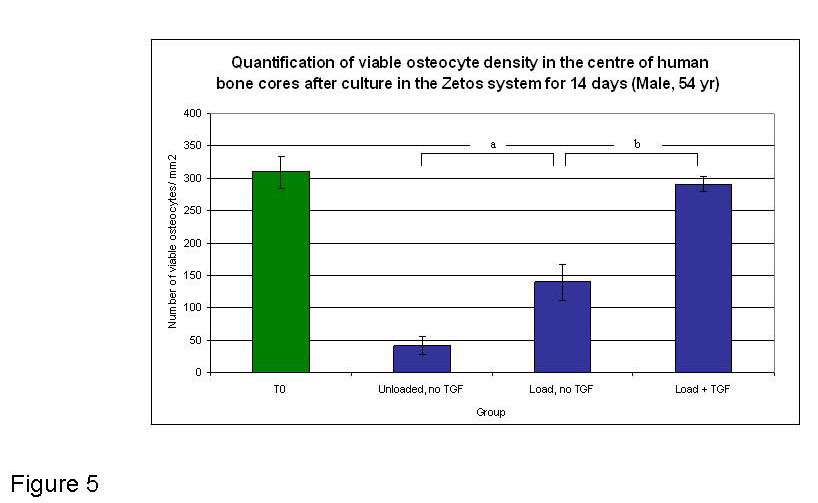
Figure 5
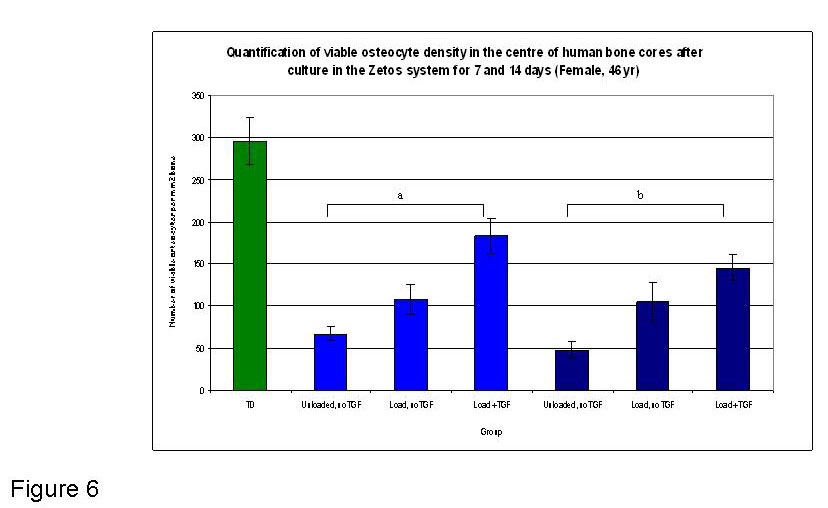
Figure 6
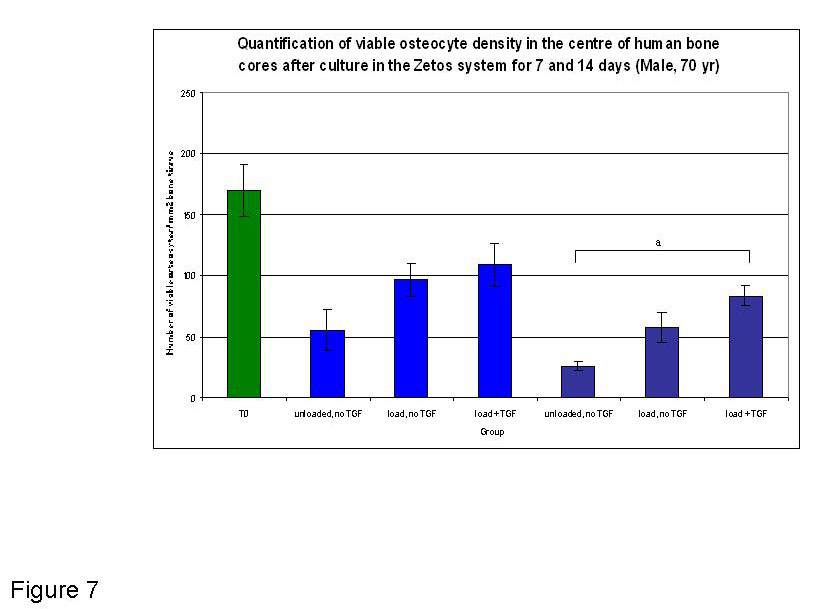
Figure 7
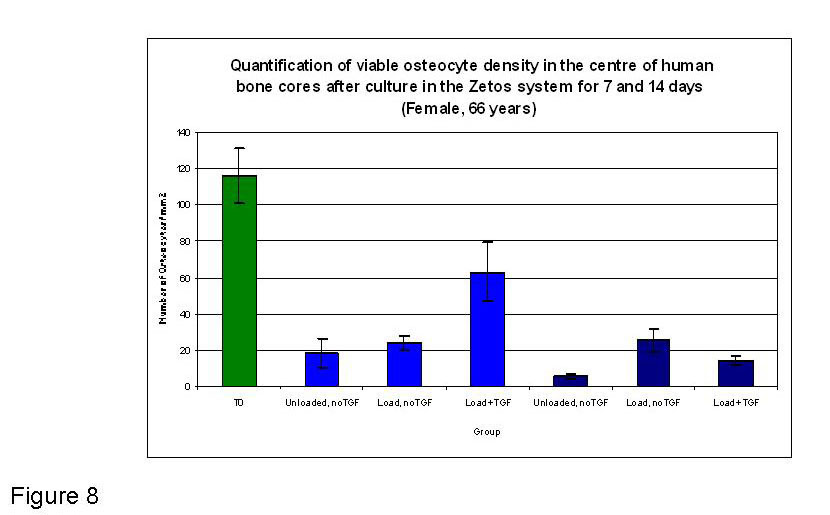
Figure 8